Early Downhome Blues
Walking the blues scale through Titon's pitch network.
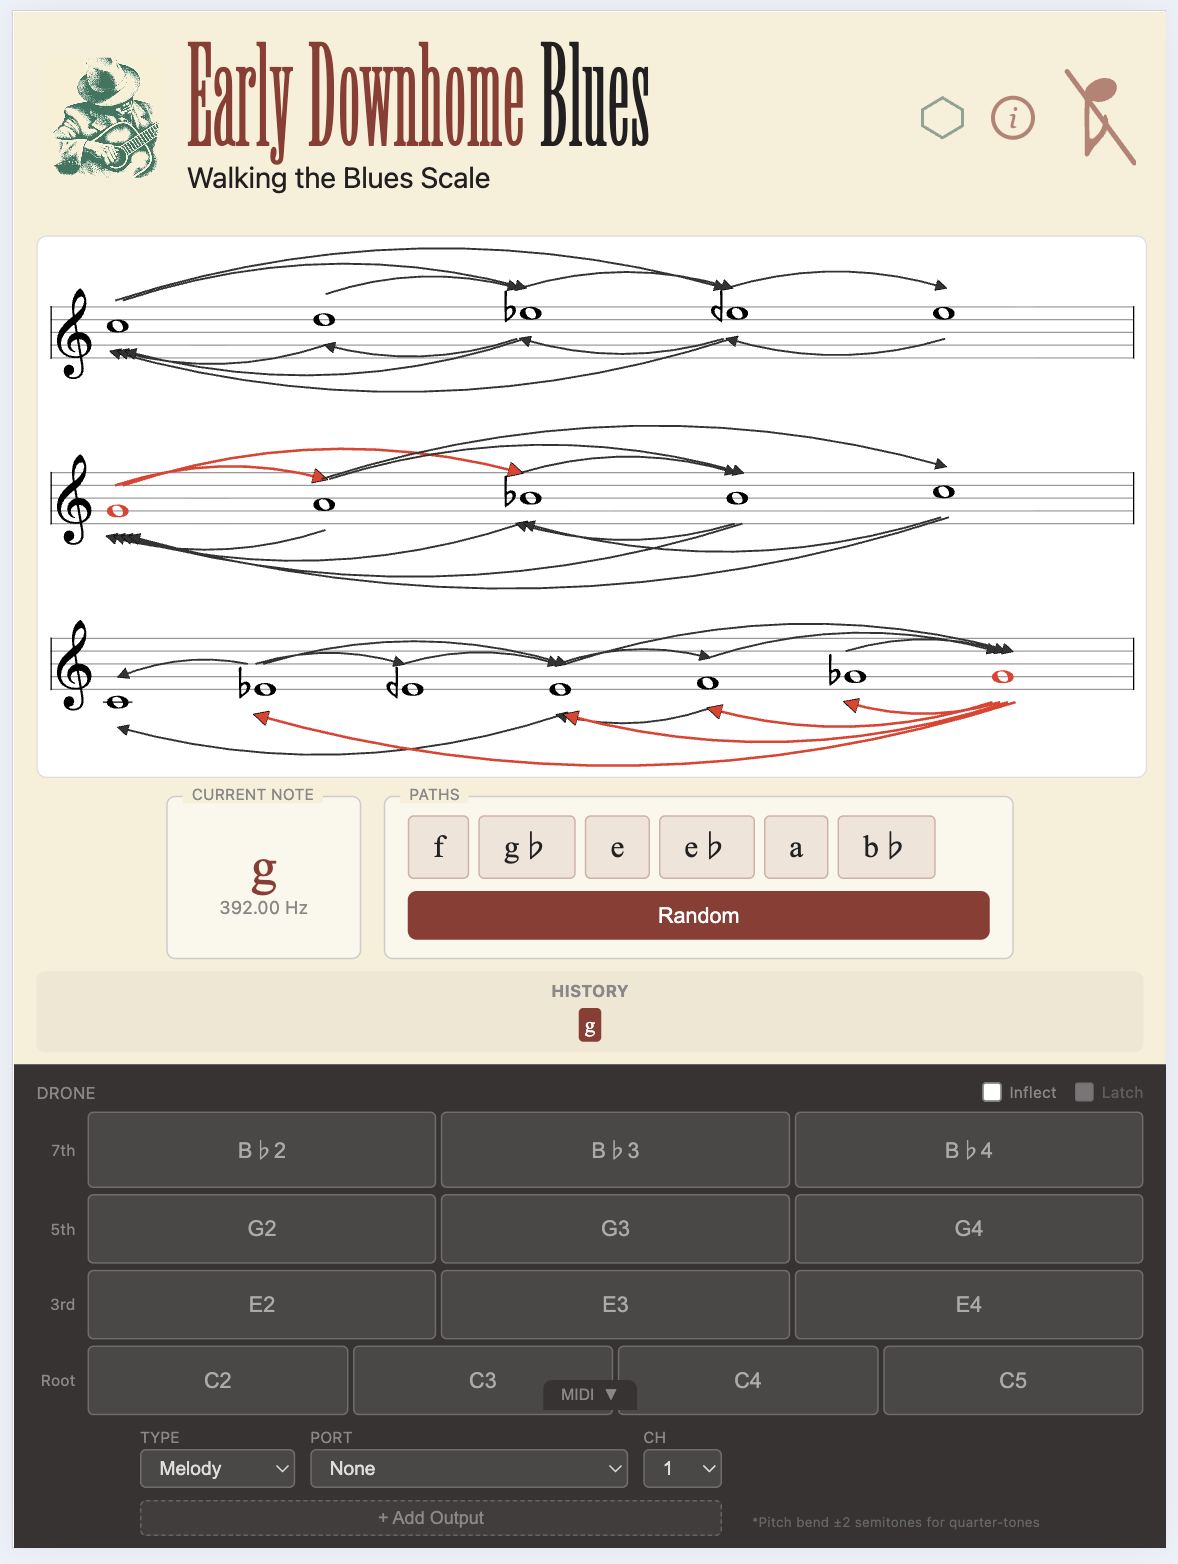
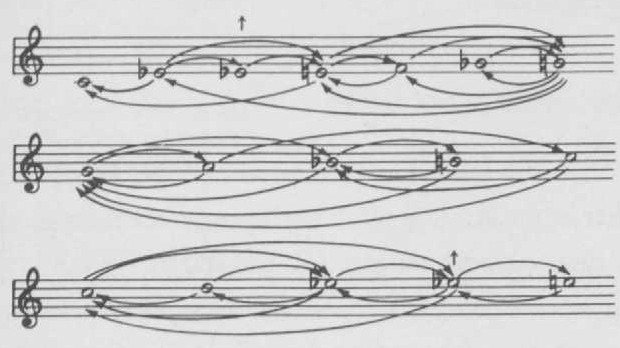
An interactive web app for exploring the pitch transition network from Jeff Todd Titon's Early Downhome Blues: A Musical and Cultural Analysis (Figure 64). Click notes on the staff to walk through the network and hear how melodies move in early blues recordings.
About the Network
Titon's pitch network maps note-to-note transitions found in early downhome blues recordings. The network has specific characteristics:
Quarter-tones: The "blue third" (E quarter-flat) sits between E flat and E natural. This microtonal inflection is central to blues melody.
Sink notes: C serves as a resolution point with no outgoing paths.
Hub notes: G connects to the most destinations, making it a key pivot point in the melodic landscape.
Current Features
Interactive notation: Click notes directly on the staff to navigate. Valid next notes are shown as paths.
Pluck synth: Guitar-like sound using Karplus-Strong synthesis.
Inflecting drone: Toggle drone notes (root, 3rd, 5th, 7th) that bend to match the melody's microtonal inflections.
MIDI output: Send notes to external instruments with pitch bend for quarter-tones (requires ±2 semitone pitch bend range).
Ensemble mode: Firebase-powered rooms for collaborative playing with Scale Navigator.
Planned Development
Song form structure: Implement 12-bar blues and AAB lyric form patterns from Titon's analysis.
Contour patterns: Add melodic contour analysis (ascending, descending, level, undulating) as described in Titon's research.
Phrase generation: Create phrase-aware melody generation using Hidden Markov Models trained on contour states.
Auto-transposition: In ensemble mode, transpose the blues scale to fit the current chord context from Scale Navigator.
Sound design: Add slide guitar mode alongside the current picked guitar sound.
Statistics view: Visualize the transition matrix and network graph with D3.
Reference
Titon, Jeff Todd. Early Downhome Blues: A Musical and Cultural Analysis. 2nd ed., University of North Carolina Press, 1994.